The Huff Model has been a cornerstone since the 1960s, helping marketers, urban planners, and economists understand where people are likely to go based on location. But in today’s dynamic world, the traditional model's limitations are becoming increasingly apparent. That’s where the Dynamic Huff's Gravity Model with Covariates comes in, blending time-sensitive data and individual preferences to offer more precise predictions.
At Arima, we’ve been at the forefront of leveraging synthetic data to address these modern challenges.
The Origins of the Huff Model
The Huff Model was originally proposed in 1963 as a tool for spatial analysis. Its primary function was to predict the probability of someone visiting a particular location—whether it be a store, national park, or any other physical place—based on factors such as distance and attractiveness.
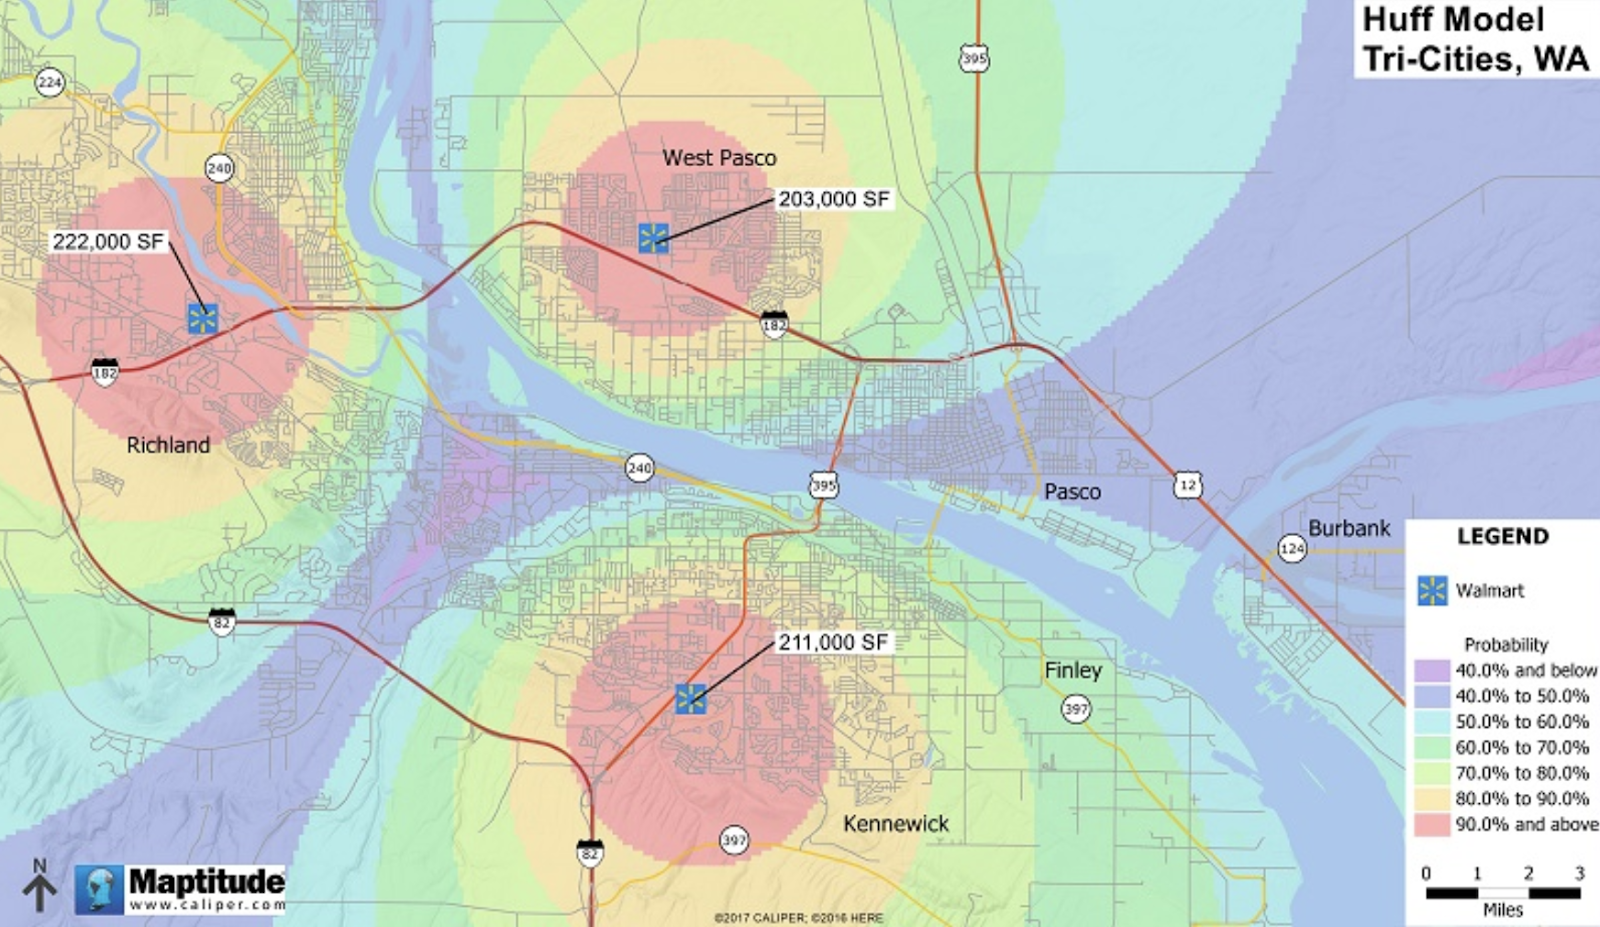
At its core, the model worked by weighing the attractiveness of a location (usually measured by size as a proxy) against the distance from the person’s home. The further away someone was from the location, the less likely they were to visit. This was often expressed through exponential decay parameters, meaning that if something is far away, your likelihood of visiting decreases significantly.
While groundbreaking in its time, the original Huff Model was limited. It didn’t account for the nuances of consumer behavior, such as different interpretations of attractiveness, ease of travel, or even changing conditions like time and seasonality. This is where modern adaptations, such as the Dynamic Huff Model with Covariates, offer a more sophisticated approach.
Enhancing the Huff Model: A Modern Approach
At Arima, we've reimagined the Huff Model by making it dynamic and incorporating covariates, allowing it to change with time and account for a wider array of factors.
Dynamic Time Integration
The dynamic aspect of our model means that predictions can now adapt to different time periods, making it possible to track how attractiveness and visitation probabilities fluctuate over weeks, months, or seasons. For example, a beach resort may be far more attractive in the summer than in the winter, and the Dynamic Huff Model can account for this.
Adding Covariates
In addition to time, we’ve integrated covariates—essentially, features that describe both site and visitor characteristics. Attractiveness is no longer a single-dimensional measure of size but a function of various factors such as:
- Site properties: Size, pricing, visitor demographics, number of facilities (e.g., restrooms), and time since last renovation.
- Consumer preferences: Does the location align with the consumer’s psychographics? Do they prefer organic food or certain ethnic products? These are crucial in understanding what makes a location attractive to different individuals.
In essence, attractiveness is no longer a single number but a complex function of multiple factors, each weighted according to its importance in the decision-making process.
Real-World Application: An Example
Let’s consider Jane, a hypothetical customer living near High Park. She has three grocery store options:
- Costco (30 minutes away)
- No Frills (15 minutes away)
- Local convenience store (3 minutes away)

Jane’s preferences include access to a car, a tendency to prefer larger stores, and a preference for quieter shopping experiences. She’s also influenced by ads and prefers shopping in stores frequented by other newcomers, like herself.
Using the Dynamic Huff Model, we can input site properties (e.g., store size, visitor demographics) and Jane’s consumer preferences (e.g., her affinity for quieter stores) to predict her likelihood of visiting each option. The model suggests that Jane would visit Costco with a 52% probability, No Frills with a 34% probability, and the local convenience store with just a 14% probability.
These predictions are based on a combination of factors, including distance, store size, and advertising exposure. By multiplying these probabilities by the number of weeks in a year, we can even estimate how many times Jane is likely to visit each store annually.
Building the Dynamic Huff Model
To build a model like this, you need three main data sets:
- Point of Interest (POI) Data: Information about store locations, types, and sizes.
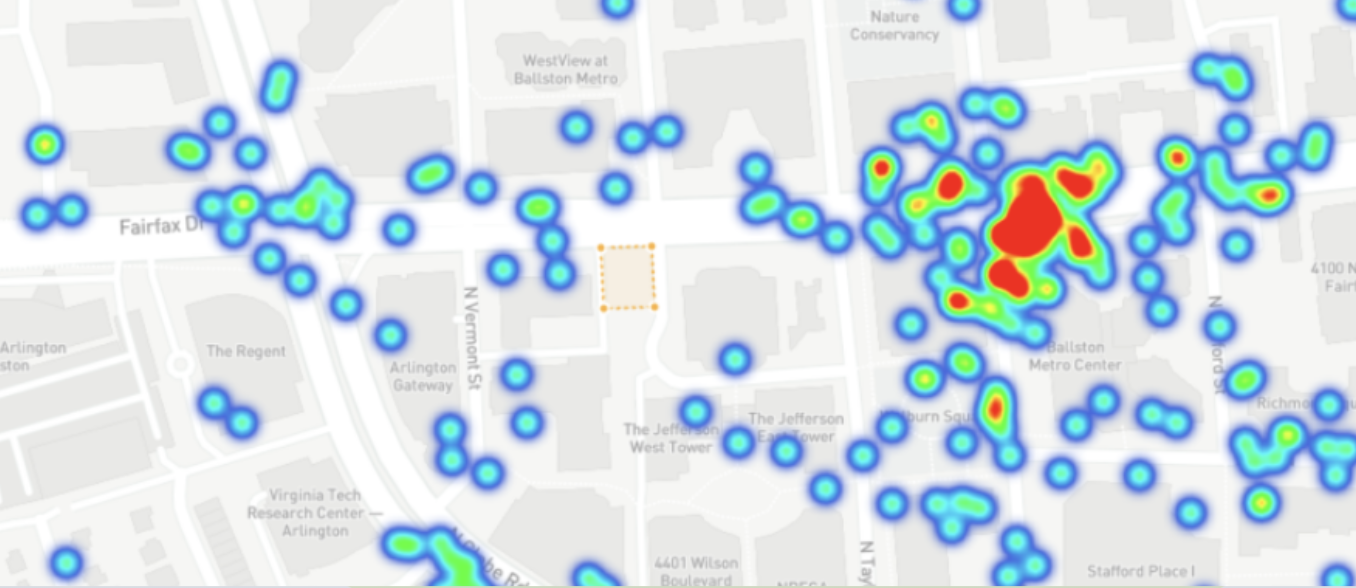
- Mobility Data: Tracks the physical movement of individuals throughout the day, helping calculate travel times and visitation likelihoods.
- Visitor Behavior Data: Information about customers, including demographics, psychographics, and behavioral patterns.
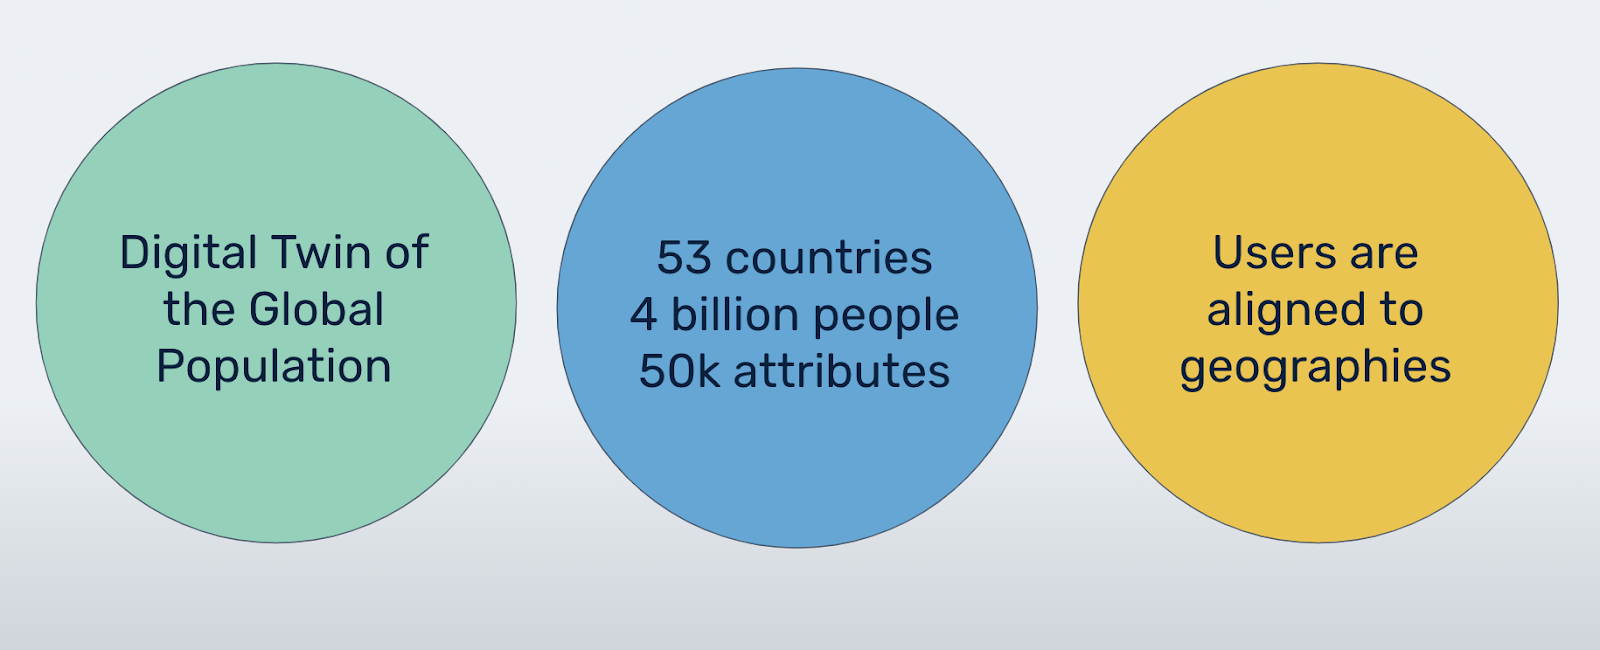
At Arima, we’ve utilized open-source datasets like Overture Maps, a rich resource containing detailed geospatial data, and our Synthetic Society dataset, which provides privacy-preserving, individual-level data on consumer behavior.
Conclusion
The Dynamic Huff Model with Covariates represents a significant leap forward in site visitation predictions. By accounting for a broader range of factors—including time, site properties, and consumer preferences—it offers a more nuanced and accurate view of where people are likely to go.
As the world becomes more complex and dynamic, so too must our models. With advanced data sets and cutting-edge modeling techniques, Arima is leading the charge in making predictive analytics more powerful and precise than ever before. Whether you’re in retail, urban planning, or any field involving physical locations, the new Huff Model can provide you with the insights you need to make smarter decisions.
So, are you ready to embrace the future of site visitation predictions? Get in touch with us to learn more.