
Our live Marketing Mix Models (MMMs) have long helped marketers, and agencies examine how various media channels and external factors contribute to sales over time through statistical analysis. Our MMMs already have the ability to help marketers understand which channels have historically generated the highest returns, identify where optimizations may be needed and forecast future revenue with certainty for the upcoming months.
Now we have added a few additional features that provide further insights.
What's New in MMM?
1. Backward and Forward Looking at the Return On Investment (ROI) Curves
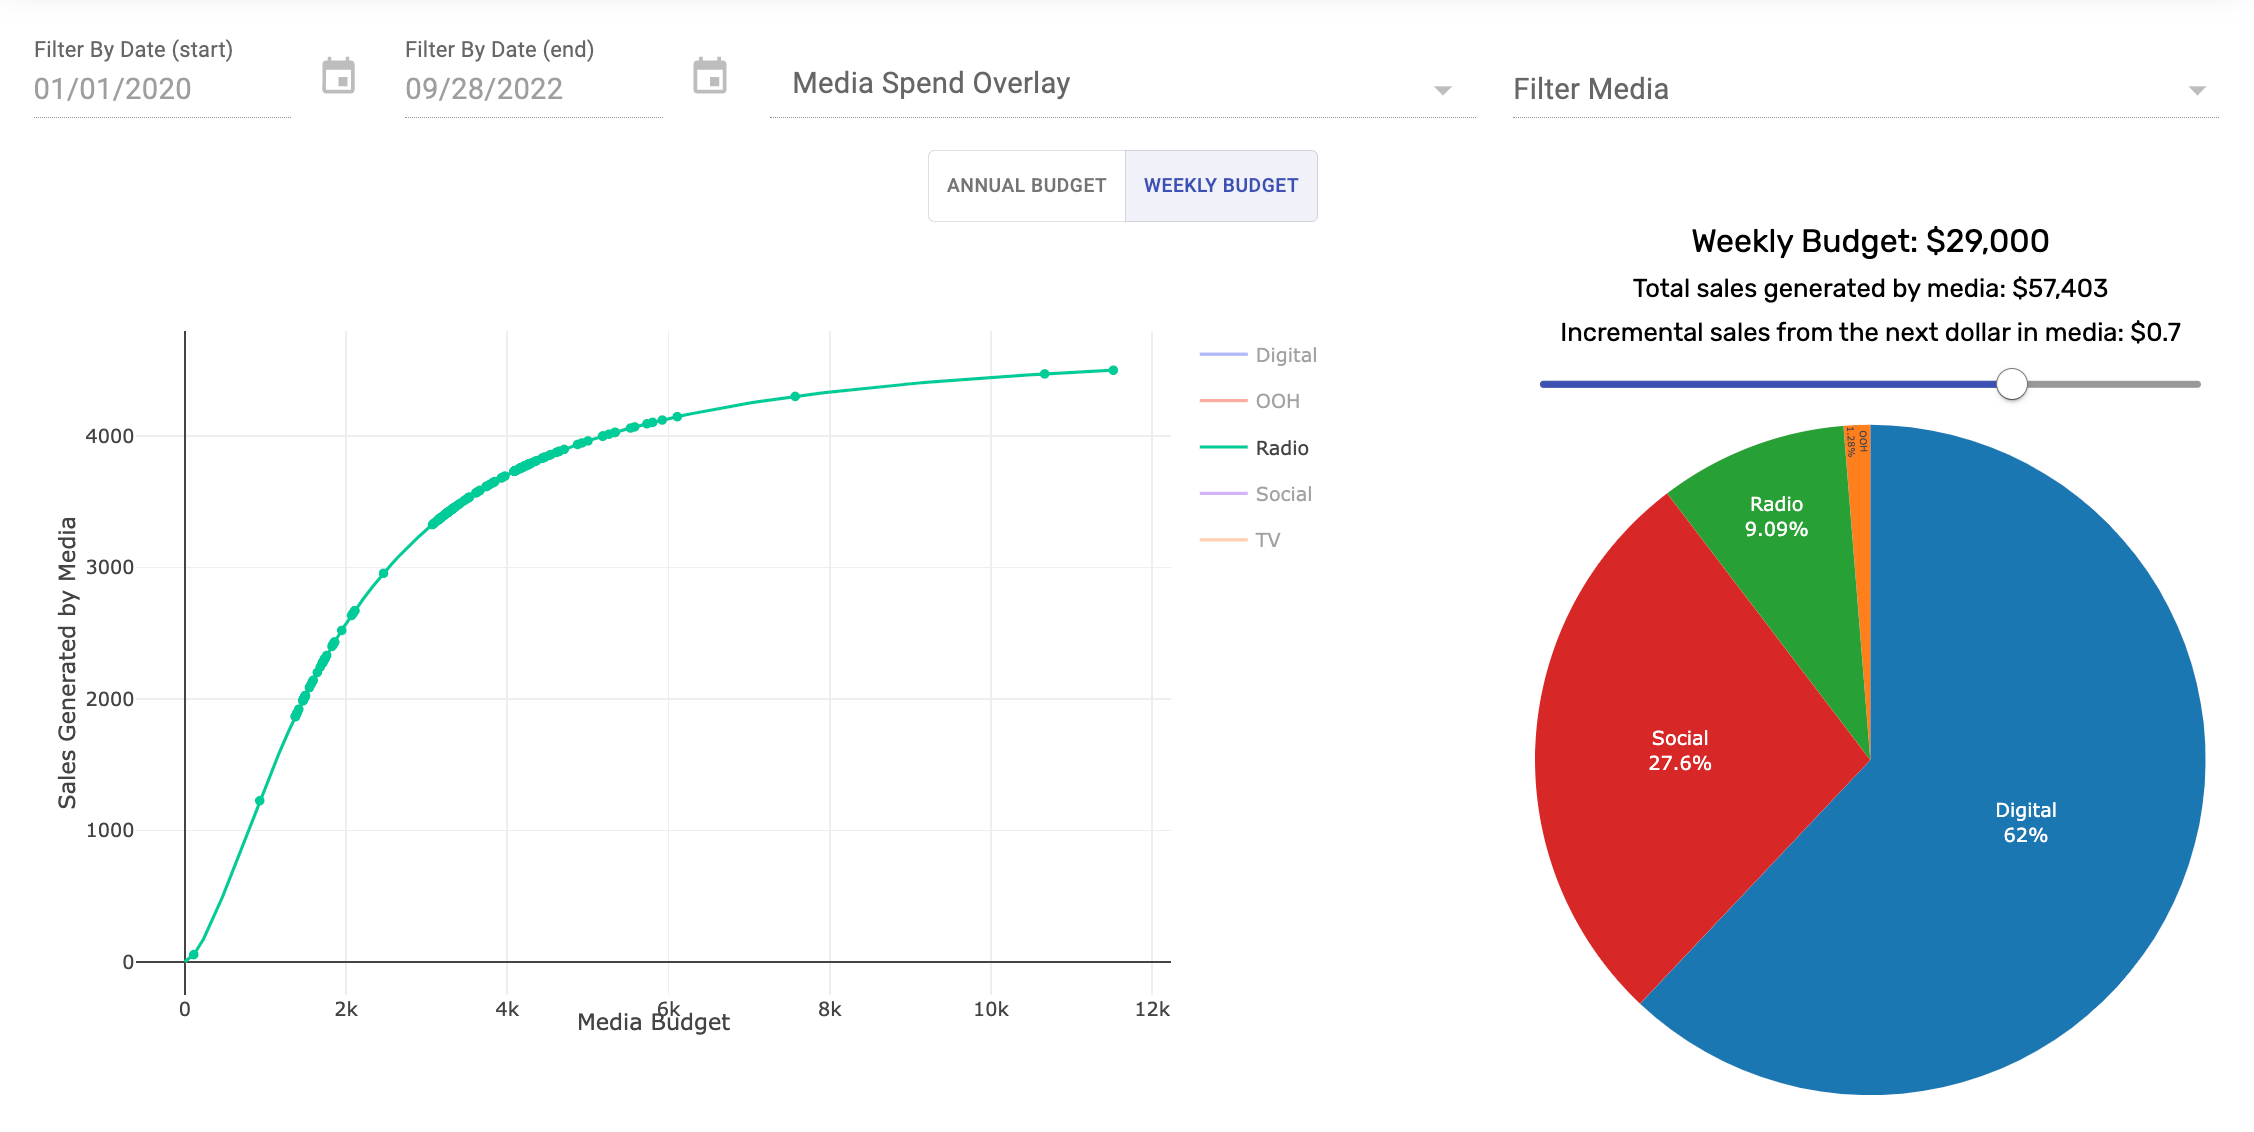
Within the Arima MMM platform, marketers and agencies can know what would be the ROI for each media channel with different budget levels through the modelled ROI curves. On top of that, users can now see where their historical spending stands on the ROI curve (i.e., how effective each spending was). In the example below, the three historical spendings for radio which stand on the curve where it becomes plateau means that there's little room for ROI growth; therefore, the business was overspending in those three weeks.
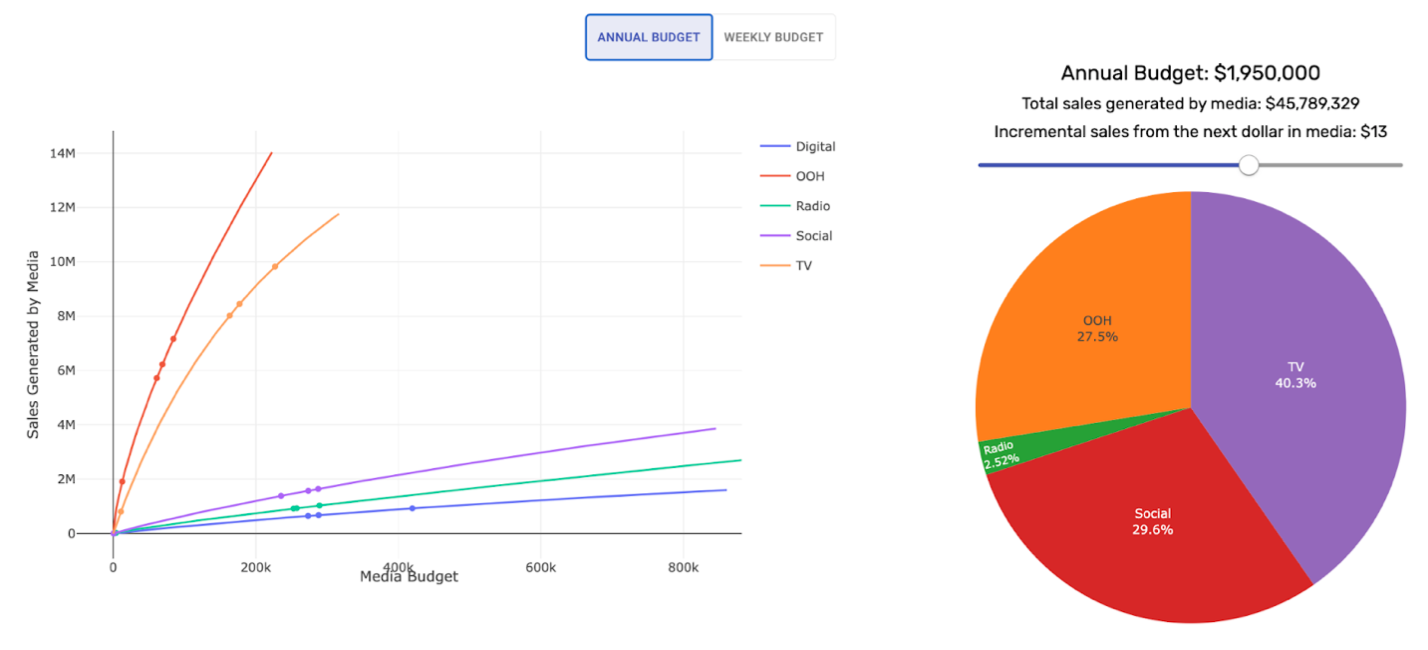
Meanwhile, by examining ROI curves, users can quickly identify which media channels in their forecasted media mix have returns that are beginning to plateau or decline and which ones are still in an upward trajectory, indicating they have room for growth. In the example below, social media, digital and radio have flattened or moderately increased YoY returns. This indicates that the advertiser's presence is likely saturated on these channels, and there is little room for further investment. Conversely, the ROI curves for TV and OOH are still on a steep incline. This suggests ample opportunity exists to increase spending and ROAS on these channels.
 2. Marginal Return on Ad Spend (mROAS) Data
In addition to showing ROAS data by media channel, users in the platform can now also see the mROAS for every channel they have invested in. So what is mROAS? mROAS is a statistical formula that tells marketers what their incremental returns would have been on a channel if an extra $1 had been spent during the period measured.
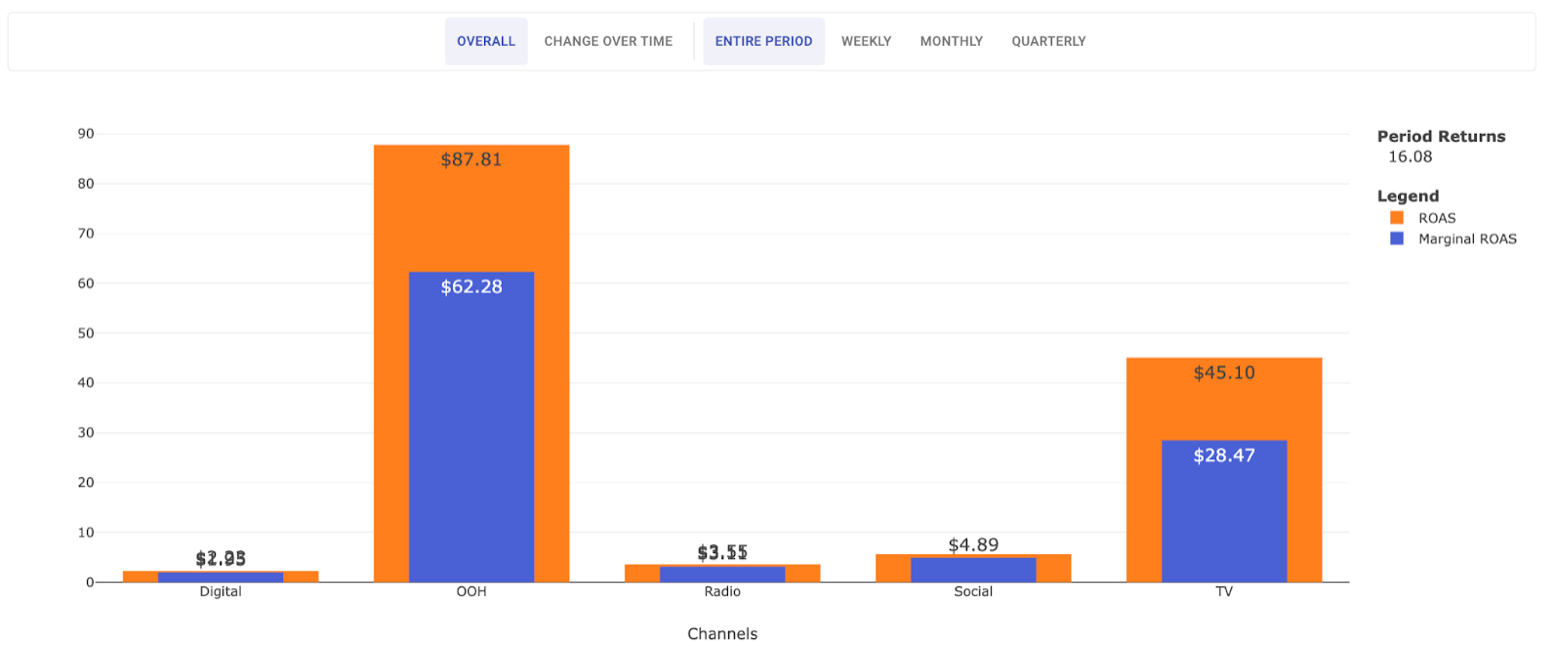
This metric is important to evaluate as it shows which channels were 'under-invested in' during that period and highlights where money was left on the table. In the above example, users can see that if they had spent more money in OOH they could have expected $62.28 in returns for every dollar spent. This amount is lower than the actualized ROAS of $87.81, but the returns would have still been very high.
3. ROAS Trending
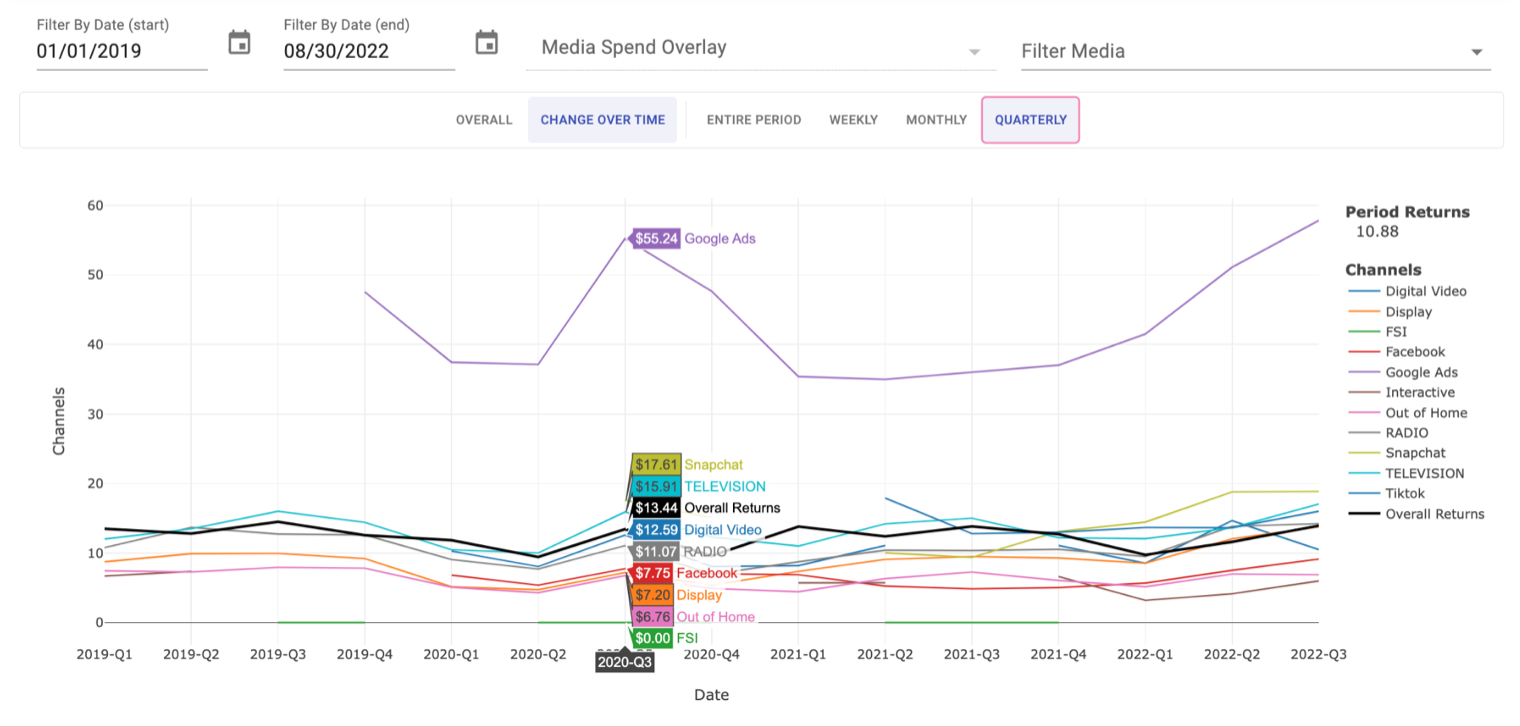
In addition to seeing ROAS data for each channel in the media mix, users can now also see how ROAS trends on a weekly, monthly or quarterly basis. This will allow users to better understand what their business's key sales drivers are and see how media optimizations and tactic changes have affected their bottom line.
Want to learn more about Arima’s evolved MMM? Talk to one of our experts to learn how you can achieve business growth with us!